Provisioning debugging guide
At times, the provisioning process will fail. When this happens, the cause for the failure should be investigated. When appropriate, customers with support contracts should contact Triton DataCenter support through their normal help channels in order to report these issues and receive guidance on addressing failures.
Prerequisites
When debugging provisioning problems you need to be root on the Triton HN.
You can debug some issues with lesser access but there will be times when you will need root access, or you will need someone with such access to run commands for you.
It is assumed that you generally know how to use pfexec and basic UNIX commands.
It's also good to understand how provisioning works so that you can follow the process through to figure out where it broke. (See next section for an overview)
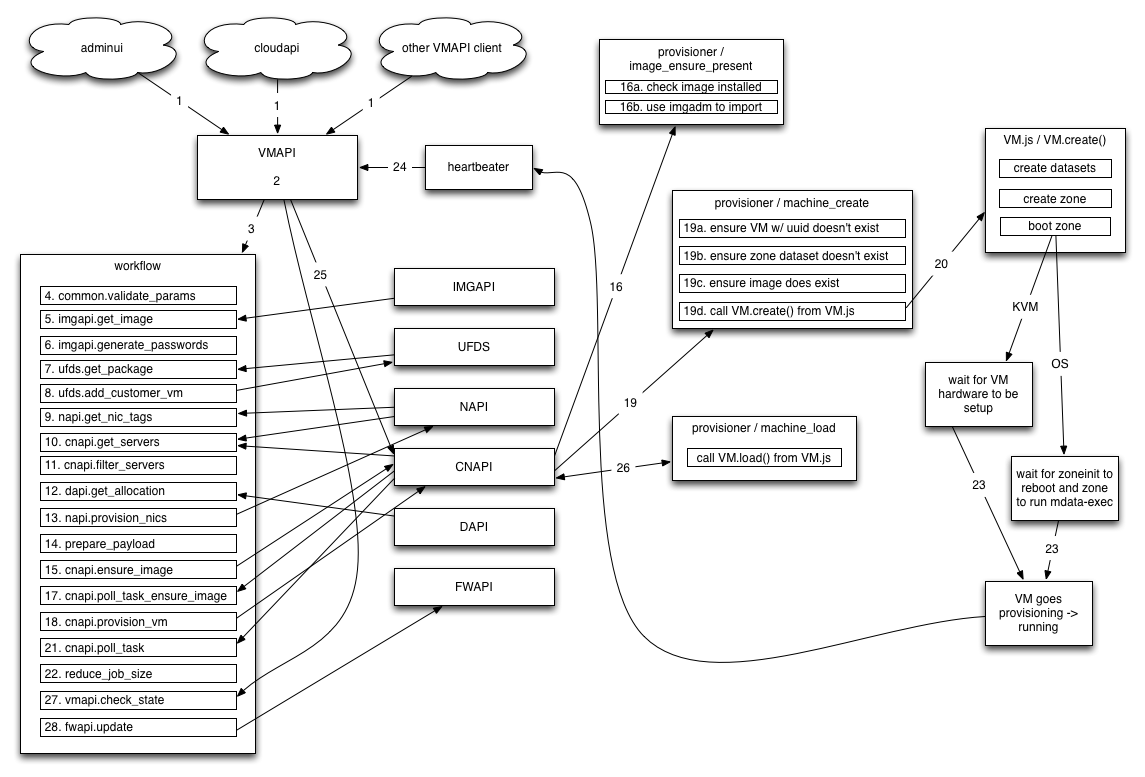
How provisioning works
-
Provision is submitted to VMAPI's /vms endpoint with POST
-
VMAPI does some basic validation and adds defaults to provision payload
-
VMAPI creates a new "provision" job in workflow with the provisioning params
- vmapi.git: lib/workflows/provision.js defines the tasks this will run
- the rest of the provision is driven from the workflow job
-
The validateParams function is run to ensure that we have valid parameters to the job. If any are invalid, the job will fail.
- vmapi.git: lib/workflows/provision.js (validateParams)
-
Get the manifest for the requested image from imgapi, does
GET /images/<uuid> -
Generate any passwords defined from the image manifest, if specified in image manifest's users list. Generated passwords go in *_pw keys in VM's internal_metadata.
- vmapi.git: lib/workflows/provision.js (generatePasswords)
-
Get the package details for the instance’s billing_uuid from UFDS (using LDAP). Once the values are loaded, parameters in the provision payload are changed.
- vmapi.git: lib/workflows/job-common.js (getPackage)
-
Write some details about this instance to UFDS on the customer record (owner_uuid) to be used by the limits plugin.
- vmapi.git: lib/workflows/provision.js (addCustomerVm)
-
For the networks specified in the provision payload, find the set of NIC tags that a given server would need for us to possibly provision this instance on it.
- vmapi.git: lib/workflows/provision.js (getNicTags)
-
Get the list of servers from NAPI that match the networks requested, then get the server data from CNAPI for that list of servers.
- vmapi.git: lib/workflows/provision.js (getServers)
-
The getServers returned the list of servers that have any of the required networks this step filters that list down to the servers that have all of the requested network tags.
- vmapi.git: lib/workflows/provision.js (filterServers)
-
Sends the instance payload and the list of servers to DAPI, If successful, this server_uuid is used for this provision.
- vmapi.git: lib/workflows/provision.js (getAllocation) Note: with clients other than cloudapi (eg. adminui) it's possible to specify to provision on a specific server. If you do this, currently DAPI is not called.
-
Create NIC objects for each of the instance’s NICs in NAPI.
- vmapi.git: lib/workflows/job-common.js (provisionNics)
-
Filter unwanted keys and normalize the payload for sending to CNAPI/provisioner.
- vmapi.git: lib/workflows/provision.js (preparePayload)
-
Call out to CNAPI and check if the required image is installed on the CN, if not, install it. CNAPI itself sends a request to provisioner to run the image_ensure_present task.
- vmapi.git: lib/workflows/provision.js (ensureImage)
-
The image_ensure_present task runs on the CN from provisioner. It checks whether the requested image is already installed, if not it imports it using imgadm.
- provisioner.git: lib/tasks/image_ensure_present.js
-
Because the previous 2 steps use AMQP and are async, we need to poll to see when the ensure_image has completed for the CN. We do this by polling CNAPI every second looking at the status of the task. When the status is 'complete' or 'failure' we either move on to the next step or fail the job task accordingly.
- vmapi.git: lib/workflows/job-common.js (pollTask)
-
This is where we actually send the provision to the server that's been chosen for this provision. The provision parameters we built with prepare_payload are sent to the VmCreate endpoint in CNAPI.
-
When CNAPI receives a provision request, it sends the provision to the provisioner agent through AMQP. The task that runs is called machine_create.
- provisioner.git: lib/tasks/machine_create.js
-
Instance is created on CN and boot is started. Note: it will stay in state 'provisioning' for now
- [smartos-live.git](https://github.com/TritonDataCenter/smartos-live: src/vm/node_modules/VM.js (exports.create)
-
Again since provisioner tasks are sent asynchronously to CNs via AMQP, we need to poll for the provisioner task completing. We'll check w/ CNAPI every second for the status of the task to change to 'complete' or 'failure'.
- vmapi.git: lib/workflows/job-common.js (pollTask)
-
This step exists solely to destroy information (servers list and filteredServers list) from the job and therefore reduce job size.
- vmapi.git: lib/workflows/provision.js (reduceJobSize)
-
Depending on whether the instance uses HVM or OS virtualization, the mechanism for instances going provisioning -> running is slightly different. But this will occur sometime after the instance is booted.
-
Heaterbeater gathers data on each CN every 5 seconds. When it sees an instance move provisioning -> running, it sends heartbeat which is recieved by both CNAPI and VMAPI. CNAPI uses this to update the 'vms' member of CN objects. VMAPI uses this data as described below.
- heartbeater.git: bin/heartbeater.js
- smartos-live.git: src/vm/node_modules/VM.js (waitForProvisioning)
-
VMAPI sees heartbeat, sends machine_load task to provisioner through CNAPI using the synchronous VmLoad endpoint. When this returns, VMAPI updates the instance state (this is what triggers vmapi.check_state below).
- vmapi.git: lib/heartbeater.js
-
Underneath, the VmLoad in CNAPI, CNAPI will talk to provisioner over AMQP and wait for the response to the machine_load task.
- provisioner.git: lib/tasks/machine_load.js
-
This task polls VMAPI every second waiting for the instance to go out of 'provisioning' state, and specifically to the 'running' state for most of our instances. (stopped if 'autoboot' is false) If the state moves to what we expect before timeout, this task succeeds.
- vmapi.git: lib/workflows/job-common.js (checkState)
- This updates FWAPI and tells it to update the state of firewall rules that might point to this instance. (eg. it updates rules on other instances that might need to allow this one)
- vmapi.git: lib/workflows/job-common.js (updateFwapi)
Notes:
- I've simplified things here (such as not showing all AMQP interactions) in order to try to make it more legible and to give a high-level overview.
- I've also omitted most discussion of error handling here. The above mostly represents the 'successful' provision case. See other sections below for more details on how things fail.
Where to start
The first step in investigating any provision failure is to determine how far the provision got. Basically the following:
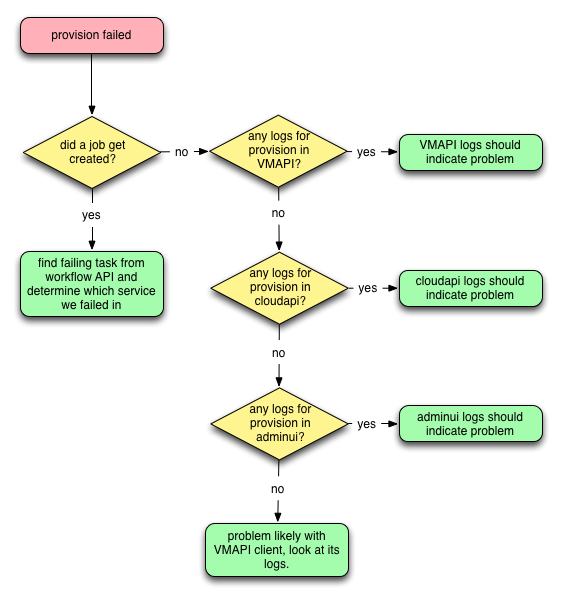
The key here is to determine whether the instance got as far as having a provision job created or not. Most of the time that failures get reported in Triton it's based on there already being a failed job and it having shown up in their reports. We'll assume here there's a job and if not you can look through the logs as described in the flowchart above.
If you have the instance UUID and not the job UUID, you can run:
Headnode# sdc-vmapi /vms/<vm_uuid>/jobs | json -Ha uuid name created_at executionwhich will give a list of all the jobs for the instance in 4 columns:
- the job UUID
- the name of the job (you're looking for something like provision-7.0.25)
- the time the job was created
- the status of the job (should be 'failed' otherwise not a provision failure)
Once you have the job UUID, the next step is to look through the job data and figure out where the job failed. This is covered in the next section.
How to read workflow jobs
There are many fields in a job but only a few are usually needed to determine where a provision failed. A good place to start is (using the UUID from the above as an example):
Headnode# sdc-workflow /jobs/7c992699-6166-42bd-94ba-1de449d20d7e | json -H name created_at elapsed params.x-request-id
provision-7.0.24
2013-12-18T22:21:32.992Z
451.523
bf4d8930-6832-11e3-9e6c-91d56d6d04e1
You can see here that this was indeed a provision task using provision workflow version 7.0.24 (more on this later) and the job was created at 2013-12-18T22:21:32.992Z (times are UTC everywhere in Triton) and it took 451.523 seconds for the job to run. The main reason the time is useful here is for when we need to look at logs and match up times when things happened. Also for comparing to other jobs which might have run and impacted this provision. The last field in this output is the request-id, all APIs and tools should be passing this down through the stack (when they're new enough) so it can be very useful for pulling together all records related to a provision.
The above doesn't tell us where we actually got to in the provision, and for that we need to look at the job's "chain_results":
Headnode# sdc-workflow /jobs/7c992699-6166-42bd-94ba-1de449d20d7e | json -H chain_results
[
  {
    "result": "All parameters OK!",
    "error": "",
    "name": "common.validate_params",
    "started_at": "2013-12-18T22:21:37.283Z",
    "finished_at": "2013-12-18T22:21:37.679Z"
  },
  {
    "result": "Got image",
    "error": "",
    "name": "imgapi.get_image",
    "started_at": "2013-12-18T22:21:37.718Z",
    "finished_at": "2013-12-18T22:21:38.258Z"
  },
  {
    "result": "Image has generate_passwords=true but no users found",
    "error": "",
    "name": "imgapi.generate_passwords",
    "started_at": "2013-12-18T22:21:38.290Z",
    "finished_at": "2013-12-18T22:21:38.483Z"
  },
  {
    "result": "Package for provision found on UFDS",
    "error": "",
    "name": "ufds.get_package",
    "started_at": "2013-12-18T22:21:38.513Z",
    "finished_at": "2013-12-18T22:21:39.350Z"
  },
  {
    "result": "Customer VM usage added to UFDS",
    "error": "",
    "name": "ufds.add_customer_vm",
    "started_at": "2013-12-18T22:21:39.397Z",
    "finished_at": "2013-12-18T22:21:40.200Z"
  },
  {
    "result": "NIC Tags retrieved",
    "error": "",
    "name": "napi.get_nic_tags",
    "started_at": "2013-12-18T22:21:40.228Z",
    "finished_at": "2013-12-18T22:21:40.732Z"
  },
  {
    "result": "Got servers",
    "error": "",
    "name": "cnapi.get_servers",
    "started_at": "2013-12-18T22:21:40.776Z",
    "finished_at": "2013-12-18T22:21:46.167Z"
  },
  {
    "result": "Filtered servers with NIC Tag requirements",
    "error": "",
    "name": "cnapi.filter_servers",
    "started_at": "2013-12-18T22:21:46.199Z",
    "finished_at": "2013-12-18T22:21:54.345Z"
  },
  {
    "result": "Server allocated!",
    "error": "",
    "name": "dapi.get_allocation",
    "started_at": "2013-12-18T22:21:54.374Z",
    "finished_at": "2013-12-18T22:22:10.993Z"
  },
  {
    "result": "NICs allocated",
    "error": "",
    "name": "napi.provision_nics",
    "started_at": "2013-12-18T22:22:12.793Z",
    "finished_at": "2013-12-18T22:22:28.556Z"
  },
  {
    "result": "Payload prepared successfully",
    "error": "",
    "name": "prepare_payload",
    "started_at": "2013-12-18T22:22:28.587Z",
    "finished_at": "2013-12-18T22:22:38.702Z"
  },
  {
    "result": "Ensure image task queued!",
    "error": "",
    "name": "cnapi.ensure_image",
    "started_at": "2013-12-18T22:22:38.743Z",
    "finished_at": "2013-12-18T22:22:48.919Z"
  },
  {
    "result": "Job succeeded!",
    "error": "",
    "name": "cnapi.poll_task_ensure_image",
    "started_at": "2013-12-18T22:22:48.948Z",
    "finished_at": "2013-12-18T22:22:59.562Z"
  },
  {
    "result": "Provision queued!",
    "error": "",
    "name": "cnapi.provision_vm",
    "started_at": "2013-12-18T22:22:59.596Z",
    "finished_at": "2013-12-18T22:23:10.526Z"
  },
  {
    "result": "",
    "error": {
      "name": "Error",
      "message": "VM.create error: timed out waiting for /var/svc/provisioning to move for a8d2e0fd-1224-468d-ad0b-9411b63ab6d5"
    },
    "name": "cnapi.poll_task",
    "started_at": "2013-12-18T22:23:10.562Z",
    "finished_at": "2013-12-18T22:28:14.305Z"
  }
]
There is a lot of output here, but it should be relatively easy to follow. Especially if you look at the "How Provisioning Works" section above. You'll see that there's one object here for each of the jobs tasks we got to. Each task will have the fields:
- result - a string output by the task, not usually that helpful
- error - this should be empty except on the final task (the one that failed)
- name - the name of the task as in the provision workflow
- started_at - the time the task started
- finished_at - the time the task stopped running
Since this guide is about failures, the last task in this chain_results is almost always the most important. But it is helpful sometimes to follow through the chain (described in "How Provisioning Works" above) to see what other things should have happened before we got to where we failed.
Sometimes the error message on the task will immediately indicate the problem and further investigation is not required. I'll try to provide examples of these in the "Common Pathologies" section below as they come up in production.
In the example above we see that the provision failed in the 'cnapi.poll_task' which happens (see diagram) after the provision has been sent to the CN and while we're waiting for it to return. So in this case we'll want to start with the log for provisioner on the CN. See section below on "Where To Find Logs".
Where to find logs
Logs are listed approximately in the order they'd first be involved in a provision. Note that in the following, paths may include the following strings which mean:
- DC is the data center name (eg. us-east-1)
- YYYY is the four digit year (eg. 2014)
- MM is the two digit month (eg. 01 for January)
- HH is the two digit hour UTC (eg. 19 for logs from 19:00UTC)
- UUID is the UUID of the service zone (eventually there will be multiple)
cloudapi
The cloudapi logs will be in one of two places:
/var/svc/log/smartdc-application-cloudapi:cloudapi-*.log(the * here because there's a different log for each port/instance) in the cloudapi zone, these are just the service logs and only usually helpful if the cloudapi service itself is having problems./var/log/cloudapi.login the cloudapi zone
The cloudapi logs are bunyan/restify logs and most likely you'll be looking for POST requests around the time of the expected provision. If you have the x-request-id value from the job, you can grep for that here too. Cloudapi is rarely the problem once the provision has made it to a job. When it is, it's usually because it somehow sent bad data to VMAPI.
adminui
In the adminui zone:
/var/svc/log/smartdc-application-adminui\:default.logThe zones's logs here are bunyan/restify logs. You'll typically be looking for 'error' level messages so something like:
bunyan -l error /var/svc/log/smartdc-application-adminui\:default.logwould be a reasonable place to start. Otherwise you'll want to look at all the logs around the time the job should have been created. If you have the x-request-id value from the job, you can grep for that here too. Like cloudapi, adminui is rarely the cause of provision failures after we've gotten to a job. And when it is, it's usually because it somehow sent invalid parameters.
vmapi
In the vmapi zone:
/var/svc/log/smartdc-site-vmapi:default.log in the vmapi zoneThese logs are also restify/bunyan logs. So again starting with:
Headnode(vmapi)# bunyan -l error /var/svc/log/smartdc-site-vmapi\:default.logis a reasonable place to begin. You can also grep for the VM's uuid in this log which sometimes also gives you what you're looking for.
If the problem you're having is with vmapi.check_state failing after the provision succeeded, this is usually due to a problem getting heartbeats or writing the updated data to moray. It's worth looking for heartbeater or moray errors in that case, but you might also see things like:
[2013-12-27T19:25:19.566Z]  INFO: vmapi/heartbeater/31779 on 70b63e05-ebc9-462d-b06a-aa96e78d701f: New VM 94bb0c22-c1ee-c54f-9f11-904e3cfd6aa4, skipping updateState (vm_uuid=94bb0c22-c1ee-c54f-9f11-904e3cfd6aa4)
[2013-12-27T19:25:20.950Z] DEBUG: vmapi/heartbeater/31779 on 70b63e05-ebc9-462d-b06a-aa96e78d701f: Retry attempt #0 for VM 94bb0c22-c1ee-c54f-9f11-904e3cfd6aa4 (vm_uuid=94bb0c22-c1ee-c54f-9f11-904e3cfd6aa4)
[2013-12-27T19:25:20.952Z] ERROR: vmapi/heartbeater/31779 on 70b63e05-ebc9-462d-b06a-aa96e78d701f: Error invalidating cache state of VM 94bb0c22-c1ee-c54f-9f11-904e3cfd6aa4: Error talking to CNAPI (vm_uuid=94bb0c22-c1ee-c54f-9f11-904e3cfd6aa4, server=44454c4c-5a00-1056-8036-b2c04f485331)
    ResourceNotFoundError: VM 94bb0c22-c1ee-c54f-9f11-904e3cfd6aa4 not found
        at parseResponse (/opt/smartdc/vmapi/node_modules/restify/lib/clients/json_client.js:67:39)
        at IncomingMessage.done (/opt/smartdc/vmapi/node_modules/restify/lib/clients/string_client.js:152:33)
        at IncomingMessage.g (events.js:192:14)
        at IncomingMessage.EventEmitter.emit (events.js:126:20)
        at IncomingMessage._emitEnd (http.js:366:10)
        at HTTPParser.parserOnMessageComplete [as onMessageComplete] (http.js:149:23)
        at Socket.socketOnData [as ondata] (http.js:1485:20)
        at TCP.onread (net.js:407:27)
[2013-12-27T19:25:24.458Z] DEBUG: vmapi/heartbeater/31779 on 70b63e05-ebc9-462d-b06a-aa96e78d701f: Ignoring heartbeat from VM 94bb0c22-c1ee-c54f-9f11-904e3cfd6aa4, current retry count is 1, will process at 8 (vm_uuid=94bb0c22-c1ee-c54f-9f11-904e3cfd6aa4)
which indicates problems talking to CNAPI. (In this specific case, CNAPI was being restarted)
workflow
In the workflow zone:
/var/svc/log/smartdc-application-wf-api:default.log
/var/svc/log/smartdc-application-wf-runner:default.log
imgapi
In the imgapi zone:
/var/svc/log/smartdc-site-imgapi:default.logThese are restify/bunyan logs. So again starting with:
bunyan -l error /var/svc/log/smartdc-site-imgapi\:default.logis a reasonable place to begin. You can also grep for the image's uuid in this log which sometimes also gives you what you're looking for.
It's also often useful to look in this log for 'Executing start method' to find cases where imgapi was restarting. Since image import often takes a long time, a failure may match up with a restart.
ufds
In the ufds zone:
/var/svc/log/smartdc-application-ufds-master:PID.lognapi
In the napi zone:
/var/svc/log/smartdc-application-napi:default.logcnapi
In the cnapi zone:
/var/svc/log/smartdc-site-cnapi:default.lograbbitmq
Sadly rabbitmq is a black box and doesn't log much of anything useful. There are facilities to tell what the current state is, but that's not very helpful for looking into past failures. Logs are stored at:
/var/log/rabbitmq/rabbit.login the rabbitmq zone on the HN. This contains only major errors and a block for each new connection. You can sometimes figure out when rabbit was down by lack of connections for some period of time.
provisioner
On the compute node:
/var/log/provisionerThis log will be rotated on an hourly basis; you will need to grep for the UUID of the instance you are checking into.
Info on compute nodes for destroyed instances
/zones/archive/<uuid>/admmsgs//zones/archive/<uuid>/cores//zones/archive/<uuid>/config//zones/archive/<uuid>/svclogs//zones/archive/<uuid>/vm.json/zones/archive/<uuid>/zfs.dump/zones/archive/<uuid>/zone.xml
Qemu (for hardware virtual machines)
/zones/<uuid>/root/startvm/zones/<uuid>/root/tmp/vm.log/zones/<uuid>/root/tmp/vm.log/var/log/sdc/upload/qemu\_<uuid>*.log
Note: looking at files in the zoneroot requires appropriate permissions.
heartbeater
When there are problems related to heartbeater (or to rule it out) the first place to look is the heartbeater log on the CN hosting a given instance:
/var/svc/log/smartdc-agent-heartbeater:default.logTo understand heartbeater's log (it has its own custom format) it's important to understand a bit about how heartbeater works.
Heartbeater spins up a copy of /usr/vm/sbin/zoneevent which watches for sysevent messages related to zones. It also starts a watcher on /etc/zones using fs.watch(). It then loads the current state of zones and updates that whenever it sees a relevant change to zone's state.
Typical logs look like:
[2013-12-27T19:34:54.715Z] .Z(27,3)PMM...........
[2013-12-27T19:35:54.716Z] .Z(27,3)PMM...........
[2013-12-27T19:36:54.790Z] .Z(27,3)PMMcccccccc
[2013-12-27T19:36:59.791Z] .cZ(27,4)PMMCC
[2013-12-27T19:37:04.802Z] .Z(28,3)cPMM
[2013-12-27T19:37:09.812Z] .Z(28,3)PMM........
[2013-12-27T19:37:54.814Z] .Z(28,3)PMM....CCCCC
[2013-12-27T19:38:19.814Z] .CCZ(27,4)PMCM
[2013-12-27T19:38:24.828Z] .Z(28,3)PMM.....cccccccccc
[2013-12-27T19:38:54.830Z] .Z(28,3)PMM...........
[2013-12-27T19:39:54.934Z] .Z(28,3)PMM...........
Basically, it just outputs a line every minute unless something's going on in which case it will do so more frequently.
So these first two lines are "normal". The '.' characters simply tell you that it sent a sample to AMQP. This should happen every 5 seconds currently, regardless of whether data's changed or not.
The 'Z(27,3)' in the above means at this time heartbeater was seeing that there were 27 zones on the system that were 'running' and 3 that were not running (usually 'stopped'). Note also that this number does not include any instances that have been marked do_not_inventory. If you have these, you'll get another number like: Z(27,3,1) where the 1 indicates there's one instance that's also hidden and won't be showing up in VMAPI.
The 'P' in the above indicates that we successfully grabbed the zpool data. This should happen once per minute.
The 'M' indicates that we've gathered system memory stats or disk usage stats the fact that these both use the same letter is a bug AGENT-697, but these should always be together so 'MM' means they both worked. Where the fix is rolled out you should see 'MD' instead of 'MM', with the 'D' indicating that disk usage info has been gathered.
The 'C' entries here indicate that zoneevent reported a zone state change. We don't care about what the change was, just that something changed. Note that there are usually multiple zone events for a zone booting or stopping so it's normal to see multiple C's here for one event.
Lower case 'c' means that something changed in /etc/zones, again there could be multiple changes, but also again we don't care. We just care that something changed in which case we'll reload the data for the zones.
Typically the most useful bit of the log here is to know that something changed in some instance when we expected it to (in which case you see C/c entries around the time in question) or that an instance was seen by heartbeater to have been created or destroyed (the Z(*) numbers changing).
fwapi
In the fwapi zone:
/var/svc/log/smartdc-application-fwapi:default.logCommon pathologies
KVM instance timeout in cnapi.poll_task
If you see a KVM instance (brand == 'kvm') fail in cnapi.poll_task with an error message like:
VM.create error: timed out waiting for /var/svc/provisioning to move for a8d2e0fd-1224-468d-ad0b-9411b63ab6d5This is almost always because qemu was unable to get enough memory. If you see this message it's worth your time to go and check first on the CN in Qemu logs (see Qemu logs section) and look at the last few lines.
If you see something like:
=== OUTPUT (2014-01-29T06:33:54Z) ===
Failed to allocate memory: Resource temporarily unavailable
or:
qemu_mlock: have only locked 67645685760 of 6871947636 bytes; still trying...
qemu_mlock: have only locked 67645685760 of 6871947636 bytes; still trying...
qemu_mlock: have only locked 67645685760 of 6871947636 bytes; still trying...
or nothing at all past the:
=== OUTPUT (2014-01-29T06:33:54Z) ===line, this is almost certainly the problem. AGENT-696 added some additional debugging information for us to track down why this is happening. If you are lucky enough to have new agents with this data, the ticket has a comment with an example of pulling this data out.
When you've confirmed that Qemu failed to start because there's not enough memory, you'll usually need to look at DAPI to see why it chose this server in the first place.
OS instance timeout in cnapi.poll_task
When you see an OS instance (brand != 'kvm') fail in cnapi.poll_task with an error message like:
VM.create error: timed out waiting for /var/svc/provisioning to move for 02fc3336-c59f-e1a7-fac7-c2cc50bdfc65The most common problem is that zoneinit or one of the mdata services has failed in the zone.
When booting a non-KVM zone the important thing to know here is that there's a service called 'zoneinit' that runs and does some setup of the zone. When it completes successfully, it enables the mdata-fetch service and reboots the zone. When the zone comes up the second time and the mdata-exec service runs (which happens after mdata-fetch completes) the /var/svc/provisioning file is moved to /var/svc/provision_success. This is the signal to the watcher that the zone's provisioning is complete and the zone is moved from 'provisioning' to 'running'. If this never happens (because zoneinit service fails to reboot for example) the provision will fail with this error.
If you suspect this is the problem and the zone has not been destroyed, you should look at:
/zones/<uuid>/root/var/svc/log/system-zoneinit\:default.log/zones/<uuid>/root/var/svc/log/smartdc-mdata\:fetch.log/zones/<uuid>/root/var/svc/log/smartdc-mdata\:execute.log
mostly focussing on the last few lines of each of these. If any of these services failed to start, that often tells you what the root cause of the failure was. If they all started successfully, you might need to start looking into the VM.js/vmadm/metadata-agent log and code.
If the instance has been destroyed and the CN is running a recent platform image, the svclogs should have been archived to:
/zones/archive/<uuid>/svclogs/\*
where you should see the same files that would have been in the zoneroot's /var/svc/log at the time of destruction.
Failure polling after provision sent (instance was destroyed)
If you see something like:
{
    "result": "",
    "error": "task timeout error",
    "name": "vmapi.check_state",
    "started_at": "2014-02-24T11:08:45.746Z",
    "finished_at": "2014-02-24T11:09:45.924Z"
}
or in the VMAPI log:
[2014-02-24T11:08:47.707Z] ERROR: vmapi/heartbeater/12121 on 70b63e05-ebc9-462d-b06a-aa96e78d701f: Error invalidating cache state of VM dfe792dc-6d37-4da6-b400-f736c5cbb445: Error talking to CNAPI (vm_uuid=dfe792dc-6d37-4da6-b400-f736c5cbb445, server=44454c4c-3000-1052-8043-b3c04f485331)
    InternalError: VM.load error: zoneadm: dfe792dc-6d37-4da6-b400-f736c5cbb445: No such zone configured
one thing you should check is:
# sdc-vmapi /vms/dfe792dc-6d37-4da6-b400-f736c5cbb445/jobs | json -Ha name uuid created_at
destroy-7.0.1 24ba9505-0176-4bbe-bc50-eb7de8c987b4 2014-02-24T11:08:34.947Z
provision-7.0.24 f8c13ee5-3c40-4844-9fb6-096883802461 2014-02-24T11:06:21.821Z
In this case what you can see is that the destroy job was sent before the provision task (vmapi.check_state) here ran. Since what we're waiting for at this point is the instance state to change, this is not going to happen if the instance has been destroyed.
If you see something like:
{
    "result": "",
    "error": {
        "name": "Error",
        "message": "Error importing image 279936e6-5eae-4a87-8a37-dc3e13c36ff9 to zpool zones:\n\targv: [\"/usr/sbin/imgadm\",\"import\",\"-q\",\"-P\",\"zones\",\"279936e6-5eae-4a87-8a37-dc3e13c36ff9\"]\n\texit status: 1\n\tstdout:\nImporting image 279936e6-5eae-4a87-8a37-dc3e13c36ff9 (Pandarus 20140325T210902Z) from \"http://imgapi.eu-ams-1.example.com\"\nOrigin image 2b683a82-a066-11e3-97ab-2faa44701c5a is not installed: searching sources\nImporting origin image 2b683a82-a066-11e3-97ab-2faa44701c5a (base 13.4.0) from \"http://imgapi.eu-ams-1.example.com\"\n\tstderr:\nStderr from zfs receive: cannot receive new filesystem stream: destination 'zones/2b683a82-a066-11e3-97ab-2faa44701c5a-partial' exists\nmust specify -F to overwrite it\n\n\nstream.js:81\n      throw er; // Unhandled stream error in pipe.\n            ^\nError: write EPIPE\n    at errnoException (net.js:773:11)\n    at Object.afterWrite (net.js:597:19)"
    },
    "name": "cnapi.poll_task_ensure_image",
    "started_at": "2014-03-25T21:42:38.922Z",
    "finished_at": "2014-03-25T21:42:41.531Z"
}
as the final task in the chain, you're very likely hitting a known set of bugs tracked internally as OS-2203 and CNAPI-340 that are fixed in releases of Triton after 1-May-2014. In that case what you should look at is the state of the image on the CN. If the image is now imported on the CN:
ComputeNode# imgadm get 279936e6-5eae-4a87-8a37-dc3e13c36ff9
{
  "manifest": {
    "v": 2,
    "uuid": "279936e6-5eae-4a87-8a37-dc3e13c36ff9",
    "owner": "7b315468-c6be-46dc-b99b-9c1f59224693",
    "name": "Pandarus",
    "version": "20140325T210902Z",
    "state": "active",
    "disabled": false,
    "public": false,
    "published_at": "2014-03-25T21:13:34.026Z",
    "type": "zone-dataset",
    "os": "smartos",
    "files": [
      {
        "sha1": "b83bef0abf09731982373c80028952233bf46621",
        "size": 453477472,
        "compression": "gzip"
      }
    ],
    "requirements": {
      "min_platform": {
        "7.0": "20131120T074720Z"
      }
    },
    "origin": "2b683a82-a066-11e3-97ab-2faa44701c5a",
    "tags": {
      "homeric": "true"
    }
  },
  "zpool": "zones",
  "source": "http://imgapi.eu-ams-1.example.com"
}
ComputeNode# zfs list -t all | grep 279936e6-5eae-4a87-8a37-dc3e13c36ff9
zones/279936e6-5eae-4a87-8a37-dc3e13c36ff9                                             1.45G  2.06T  1.81G  /zones/279936e6-5eae-4a87-8a37-dc3e13c36ff9
zones/279936e6-5eae-4a87-8a37-dc3e13c36ff9@final                                           0      -  1.81G  -
[jwilsdon@8G9H95J (eu-ams-1) ~]$
then this was almost certainly a failure due to the provision starting while imgadm was still importing the image (tracked internally as OS-2203 / CNAPI-340). If, on the other hand, the broken '-partial' dataset still exists, this is likely another failure that will require operator cleanup.
If an import has failed but the dataset is not there now, a good way to proceed is to attempt an 'imgadm import
{
    "result": "",
    "error": {
        "name": "Error",
        "message": "Error importing image f9e4be48-9466-11e1-bc41-9f993f5dff36 to zpool zones:\n\targv: [\"/usr/sbin/imgadm\",\"import\",\"-q\",\"-P\",\"zones\",\"f9e4be48-9466-11e1-bc41-9f993f5dff36\"]\n\texit status: 1\n\tstdout:\nImporting image f9e4be48-9466-11e1-bc41-9f993f5dff36 (smartos64 1.6.3) from \"http://imgapi.eu-ams-1.example.com\"\n\tstderr:\nStderr from zfs receive: cannot receive new filesystem stream: invalid backup stream\n\nimgadm: error (InternalError): zfs receive error while importing: exit code 1"
    },
    "name": "cnapi.poll_task_ensure_image",
    "started_at": "2014-03-25T23:43:01.726Z",
    "finished_at": "2014-03-25T23:43:22.235Z"
}
but on the CN we see the image is imported correctly:
ComputeNode# imgadm get f9e4be48-9466-11e1-bc41-9f993f5dff36
{
  "manifest": {
    "v": 2,
    "uuid": "f9e4be48-9466-11e1-bc41-9f993f5dff36",
    "owner": "352971aa-31ba-496c-9ade-a379feaecd52",
    "name": "smartos64",
    "version": "1.6.3",
    "state": "active",
    "disabled": false,
    "public": true,
    "published_at": "2012-05-02T15:15:24.139Z",
    "type": "zone-dataset",
    "os": "smartos",
    "files": [
      {
        "sha1": "9df6543bc4bde6e2efc532fe37ce21bc95318397",
        "size": 47480510,
        "compression": "bzip2",
        "dataset_guid": "7145103344702429528"
      }
    ],
    "description": "Generic multi-purpose 64-bit SmartMachine. This image is deprecated and will be replaced by the 64 bit SmartOS Standard image (base64).",
    "urn": "sdc:sdc:smartos64:1.6.3",
    "requirements": {
      "networks": [
        {
          "name": "net0",
          "description": "public"
        }
      ]
    }
  },
  "zpool": "zones",
  "source": "http://imgapi.eu-ams-1.example.com"
}
ComputeNode# zfs list -t all | grep f9e4be48-9466-11e1-bc41-9f993f5dff36
zones/f9e4be48-9466-11e1-bc41-9f993f5dff36                                              206M  2.89T   206M  /zones/f9e4be48-9466-11e1-bc41-9f993f5dff36
zones/f9e4be48-9466-11e1-bc41-9f993f5dff36@final                                           0      -   206M  -
Gathering the details of the zpool history is useful here:
ComputeNode# pfexec zpool history | grep f9e4be48-9466-11e1-bc41-9f993f5dff36
2014-03-25.23:55:39 zfs receive zones/f9e4be48-9466-11e1-bc41-9f993f5dff36-partial
2014-03-25.23:55:43 zfs rename zones/f9e4be48-9466-11e1-bc41-9f993f5dff36-partial zones/f9e4be48-9466-11e1-bc41-9f993f5dff36
2014-03-25.23:55:44 zfs clone -F -o quota=5g zones/f9e4be48-9466-11e1-bc41-9f993f5dff36@final zones/9185c581-2252-ef4a-8b18-f8787d77e61b
to indicate that the image was successfully imported ~10m later. This indicates that whatever happened to the first provision, it was a transient issue since the second one succeeded.